Wednesday, August 19, 2015

GOLD

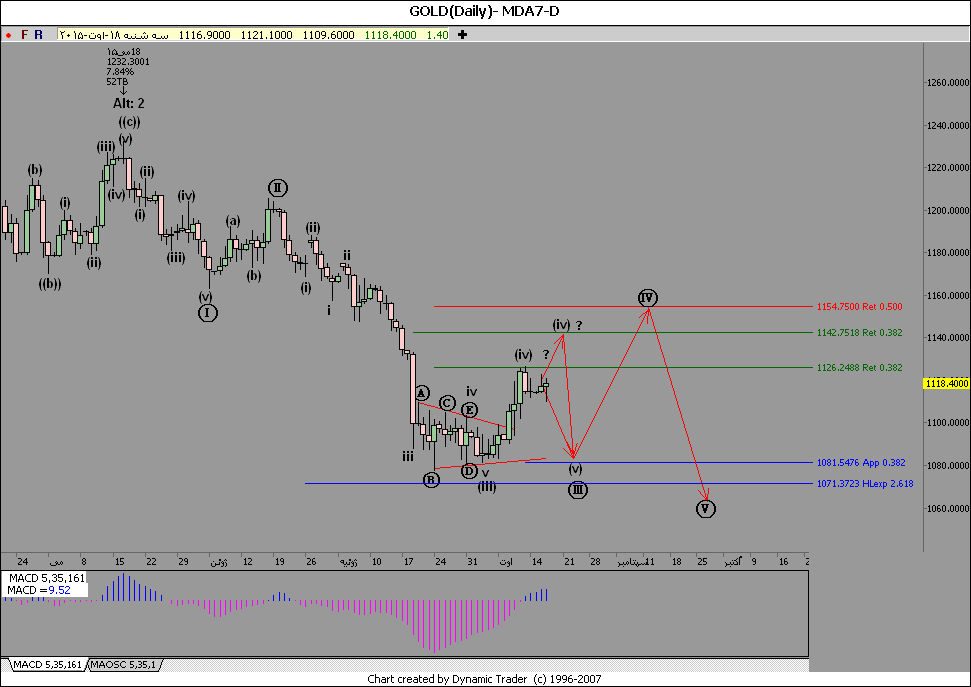
Based on how high gold price has reached, this wave is expected to be wave (iv) of 3 (circle). According to the fibo levels, we are expecting it to be halted around $1126. If any further pullback is able to breach the mentioned high, a short entfy to sell in wave five (v) could be considered, the end of the wave depends on the bearish strength momentum. If it includes low strength, $1080 could be seen as an end for the rally. But if the price is able to break $1126 by any further pulback, the next resistance level will be $1143 for the end of wave (iv), this area afterward could be considered as an entry to go short for wave (v).
Result
.


EURAUD

The price is still going bullish. on the daily chart, according to the wave counting, it is comleteing wave 5 of larger wave 3 which the upper channel line appears to be an end for that wave. As it shows, the price is completeing wave 4 of 5 of 3, which seems to have 1.4950 area as support area potentially. Within this area, we ought to look for wave 5 of 5 of 3 to find an entry trigger.
Result
.

Sunday, August 16, 2015

NZDCHF

On the h4 chart, the price is within the reciprocal ab=cd   harmonic pattern range. We are expecting to have a surge if the demand fuels up across the market.
.

Saturday, August 15, 2015

GBPUSD

on the h4 chart, the price is swinging inside a neutral rectangle. if it breaks out of the rectangle, it is expected for the price to continue trendy. as long as the price fluctuates within the area, couple of wave running could be considered.
.

EURUSD

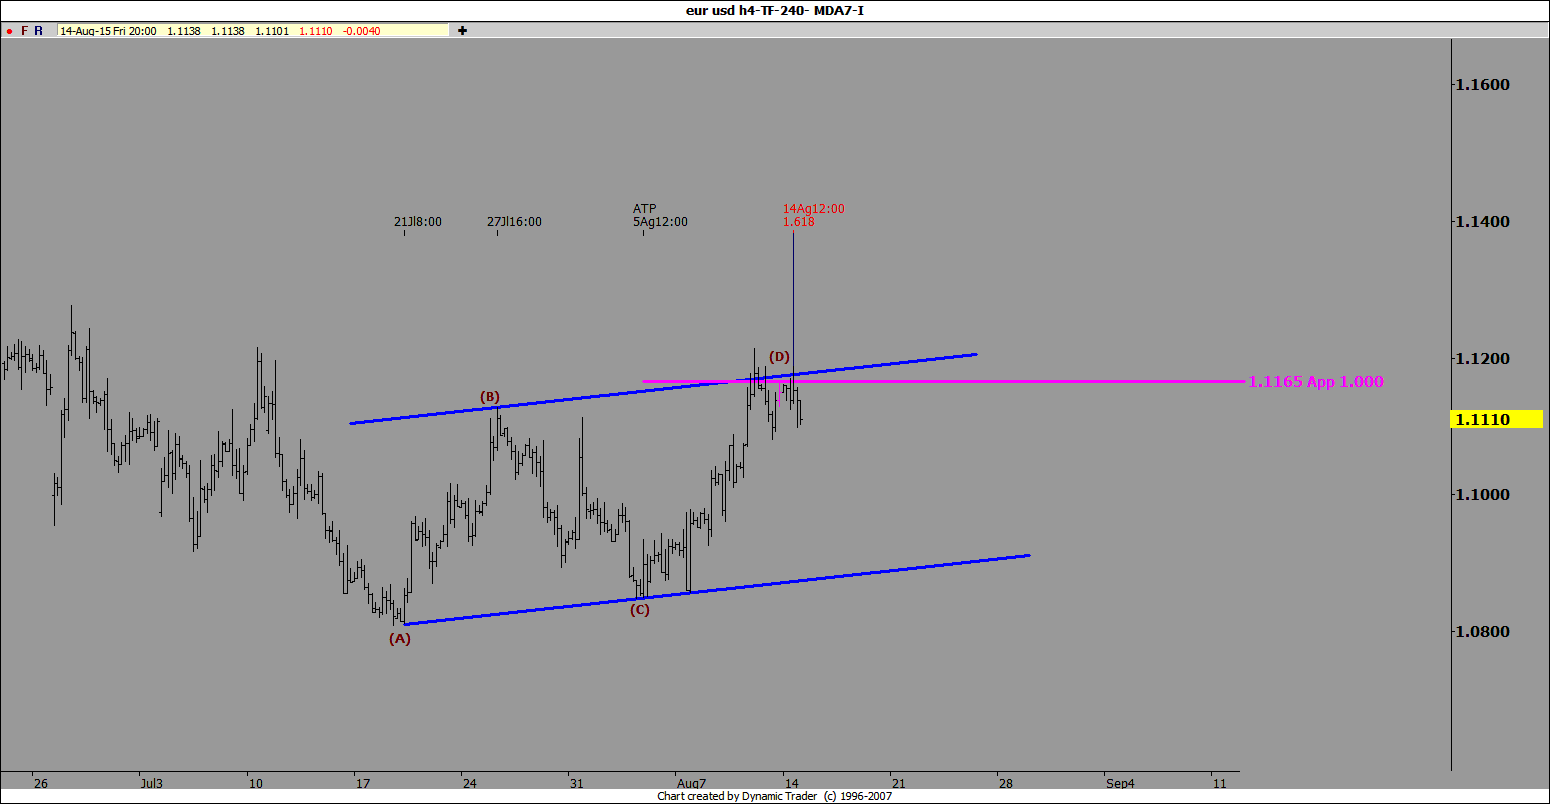
On the h4 chart, having the  ab=cd  harmonic pattern  formed a reversal is in sight. If the situation continues, we will have more drops coming in the market.
.

Thursday, August 13, 2015

OIL

On the daily chart of the crude oil, a non-ideal alt bat pattern is on sight it is expected to have a rebound if the price got steady around $42 a barrel.
.

GBPCHF

On our H4 chart, we see a reversal from top bullish channel by a bearish divergence formation. Currently and based on the head & shoulders pattern in MACD, we are expecting a drop if the S to R conversion area is broken down below 1.5130.
RESULT
.