On the h4 chart, having the ab=cd harmonic pattern formed a reversal
is in sight. If the situation continues, we will have more drops coming
in the market.
On the h1 chart, the price is fluctuating inside a bearish channel. We
are expecting a trendy move, if the price violates the top or button of
the box.
On the H4 chart, the chart is fluctuating inside a consolidation area.
We are expecting a move in line with the trend by having the price out
of this box.
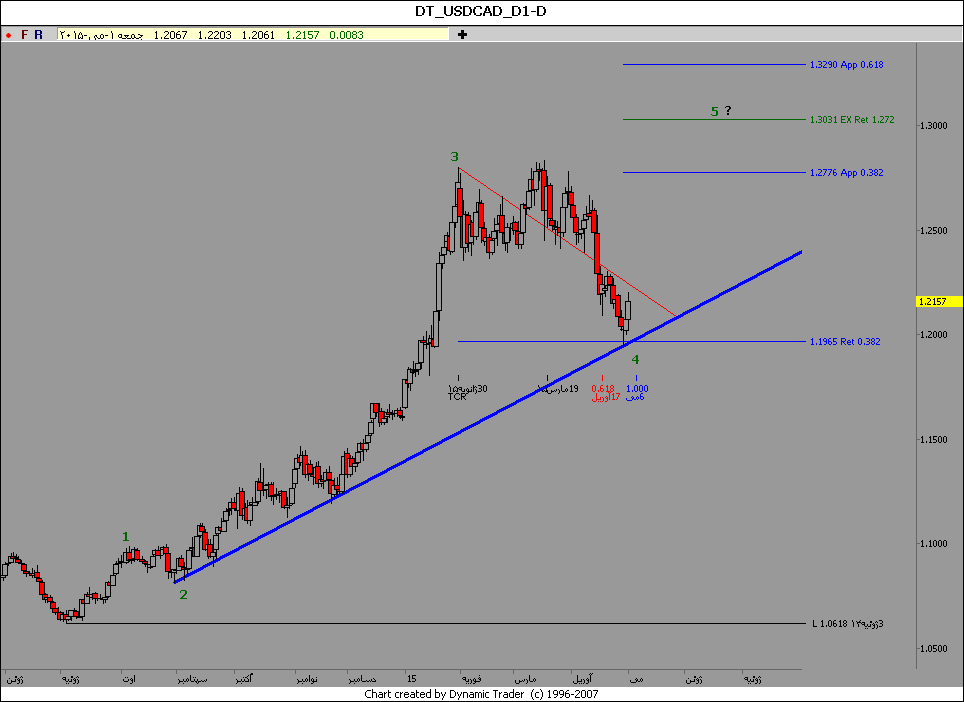
On the daily chart, the price is within the inv ab=cd harmonic pattern
range. We are expecting to have a surge if the demand fuels up across
the market.
On the H4 chart we see a reversal by having a head and shoulders top.We are expecting a drop below the neck like around 1.5054 if the price stabilized.
On the daily chart, the price is fluctuating inside a
bearish channel. We are expecting a trendy move, if the price violates the top or button of
the box.
On the daily chart, by having the shark harmonic pattern formed a reversal
is in sight. If the situation continues, we will have more drops coming
in the market.
On
the h4 chart, by having the butterfly and crab harmonic patterns
formed a reversal is in sight. If the situation continues, we will have
more drops coming in the market.
On the H4 chart, the chart is fluctuating inside a consolidation area.
We are expecting a move in line with the trend by having the price out
of this box.
On the h4 chart, by having the ab=cd and shark harmonic
patterns formed a reversal is in sight. If the situation continues, we will have
more drops coming in the market.
On the h4 chart, by having the ab=cd harmonic pattern formed a reversal
is in sight. If the situation continues, we will have more drops coming
in the market.
On the h4 chart, having the ab=cd harmonic pattern formed a reversal
is in sight. If the situation continues, we will have more drops coming
in the market.
Based on the structure, a double bottom is in sight on the h4 chart. We
are expecting to have a upward move to around 0.7180, if the neckline is
broken around 0.6977, while having s/l at 0.6765 .
On the daily chart, having the crab harmonic
pattern formed a reversal is in sight. If the situation continues, we will have
more drops coming in the market.
On the h1 chart, having the crab harmonic
pattern formed a reversal is in sight. If the situation continues, we will have
more drops coming in the market.
On the daily chart, having the shark harmonic
pattern formed a reversal is in sight. If the situation continues, we will have
more drops coming in the market.
On the H1 chart, the price is
around R to S conversion area and a price reversal is expected by having a
negative divergence formation. We are expecting to have the ground ready for a
drop to 133.00 and 131.50 area having stop loss on 135.50, if 134.30 level is
broken below as well.
As you can see on the daily
chart, a reversal candle pattern is being formed on 0.38 Fibonacci retracement
level and bullish trend line. Long position could be entered after crossing
over 1.2307.
As you can see on the H4 chart, an ab=cd has been formed and on the PRZ
levels the Wiseman pattern is on sight. Going short considering money
management to determined levels is good to know.
 .
.


.gif)