Monday, August 31, 2015

EURGBP

On the daily chart, the price is fluctuating inside a bearish channel. We are expecting a trendy move, if the price violates the top or button of the box.
.


USDCAD

On the weekly chart, having the crab harmonic pattern formed a reversal is in sight. If the situation continues, we will have more drops coming in the market.
.


USDJPY

On the h1 chart, the price is placed inside a bullish channel. We are expecting to see a drop if 120.75 level is broken below.
Result
.


GBPCHF

On the h1 chart, the chart is fluctuating inside a consolidation area. We are expecting a move in line with the trend by having the price out of this box.
.


CADJPY

on the h1 chart, the price is swinging inside a neutral rectangle. if it breaks out of the rectangle, it is expected for the price to continue trendy. as long as the price fluctuates within the area, couple of wave running could be considered.
.


GBPCAD

On the daily chart, the price is placed inside a bullish channel. We are expecting to see a drop if 2.0203 level is broken below.
.


Sunday, August 30, 2015

EURUSD

On the h4 chart, the price is bullish. Based on the slow correction behaviour we are expecting to see it rise to 1.1550 and 1.1700 zone if a positive hidden divergence happens while having the bearish trend line broken below around 1.1320. As long as the main trend line is not broken above, our forecast has validity so far.
.


Thursday, August 27, 2015

EURNZD

On the h1 chart, the chart is fluctuating inside a consolidation area. We are expecting a move in line with the trend by having the price out of this box.
Result
.


AUDCAD

On the h4chart, the price is within the ab=cd harmonic pattern range. We are expecting to have a surge if the demand fuels up across the market.
.


AUDCHF

On the h1 chart, the chart is fluctuating inside a consolidation area. We are expecting a move in line with the trend by having the price out of this box.
.


AUDUSD

Based on the structure, a Head and Shoulders Bottom is in sight on the h1 chart. We are expecting to have a upward move to around 0.7250 , if the neckline is broken around 0.7150 while having s/l at 0.7060.
.


AUDJPY

On the h1 chart, the price is fluctuating inside a bearish channel. We are expecting a trendy move, if the price violates the top or button of the box.
.


Wednesday, August 26, 2015

NZDJPY

On the h1 chart, the chart is fluctuating inside a consolidation area. We are expecting a move in line with the trend by having the price out of this box.
.


GBPJPY

On the h1 chart, the chart is fluctuating inside a consolidation area. We are expecting a move in line with the trend by having the price out of this box.
.


AUDUSD

On the h1chart, the price is within the ab=cd harmonic pattern range. We are expecting to have a surge if the demand fuels up across the market.
.


GBPAUD

On the H1 chart, the chart is fluctuating inside a consolidation area. We are expecting a move in line with the trend by having the price out of this box.
Result
.


Tuesday, August 25, 2015

GBPCAD

On the M30 chart, the chart is fluctuating inside a consolidation area. We are expecting a move in line with the trend by having the price out of this box.
Result
.


GOLD

On the daily chart, having the inv ab=cd harmonic pattern formed a reversal is in sight. If the situation continues, we will have more drops coming in the market.
Result
.


Sunday, August 23, 2015

NZDUSD

on the h4 chart, the price is swinging inside a neutral rectangle. if it breaks out of the rectangle, it is expected for the price to continue trendy. as long as the price fluctuates within the area, couple of wave running could be considered.
.

Saturday, August 22, 2015

EURUSD

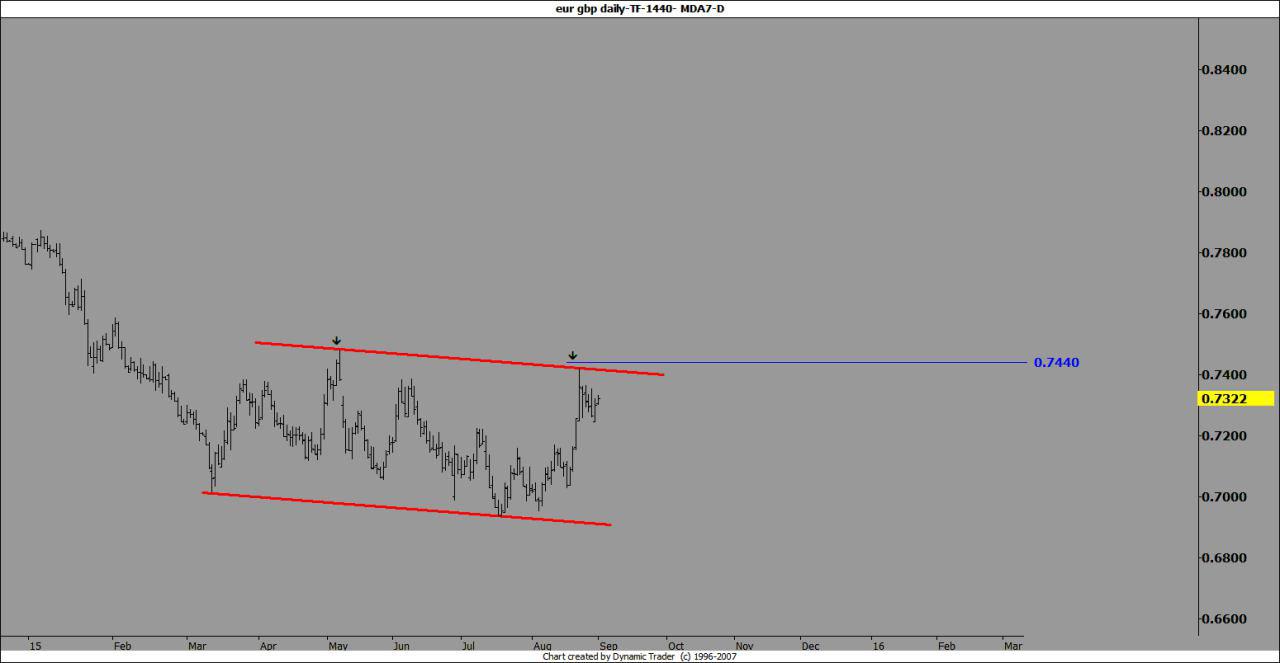
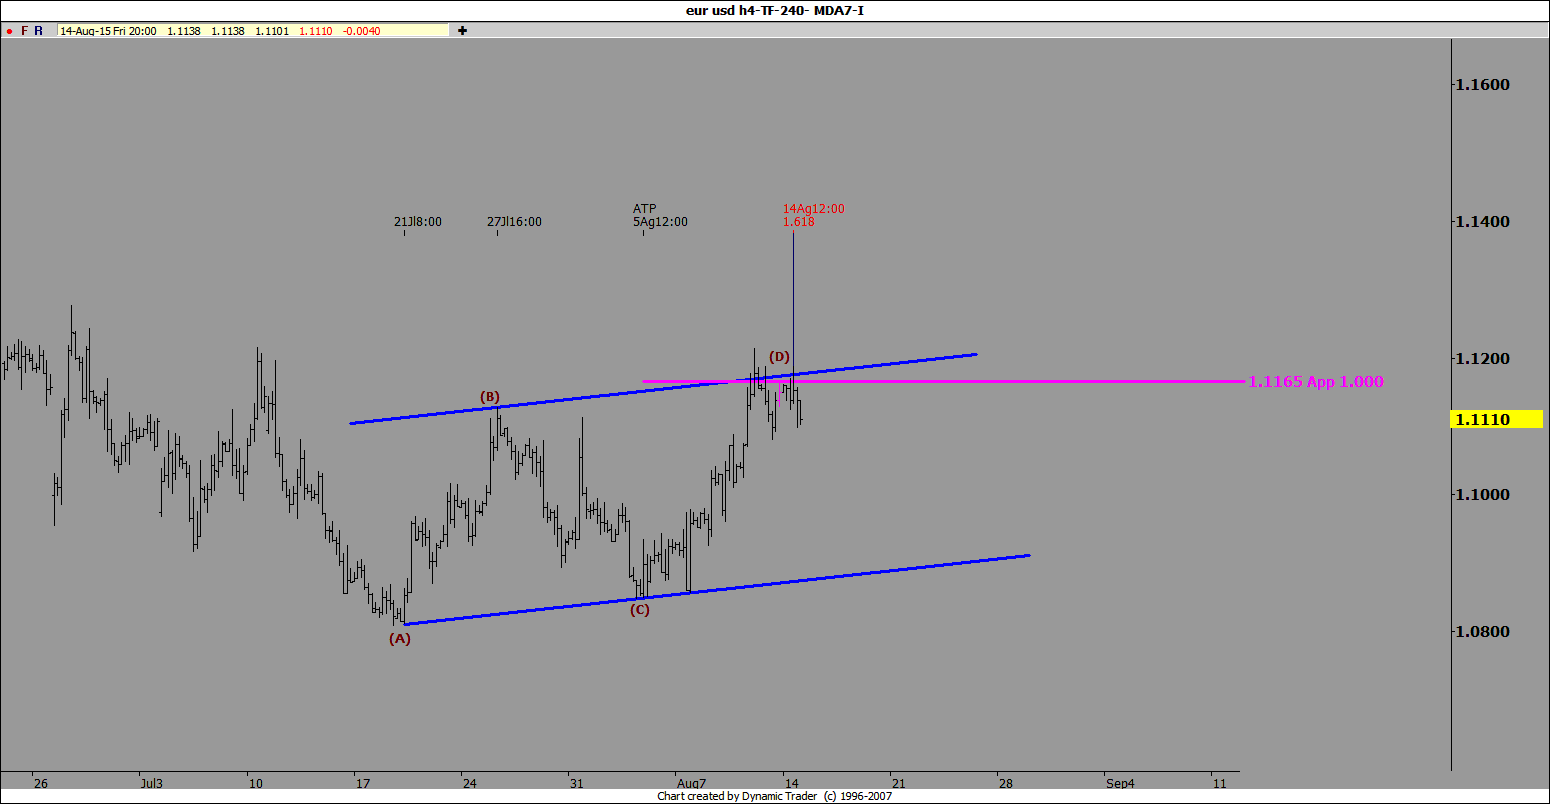
Technically, against U.S. Dollar, EUR gained quickly, which crossed 1.1265 targeting around 1.1465 last week, technically looking at the chart suggests a wolfi pattern that may initially starts a correction wave and also hitting the price to the diagonal could lead to a slowing price.
Therefore, as it is shown on the H4 chart, we are around ETA of the wolfi wave which in case of a rebound and having 1.1278 level broken, going short to the bottom of the channel is a clear option, and if the price is able to takes out the channel's lower line, an encounter with EPA LINE could be considered.
 Note: according to the time divergence, if the price was able to crosses 1.1400, PRZ for reversal would be 1.1465.
Resistances: 1.1465, 1.1640
Supports: 1.1095, 1.1265
.


Friday, August 21, 2015

GBPNZD

On the daily chart, the chart is fluctuating inside a consolidation area. We are expecting a move in line with the trend by having the price out of this box.
.

Thursday, August 20, 2015

GBPJPY

On the H4 chart, the chart is fluctuating inside a consolidation area. We are expecting a move in line with the trend by having the price out of this box.
Result
.


Wednesday, August 19, 2015

GOLD

Based on how high gold price has reached, this wave is expected to be wave (iv) of 3 (circle). According to the fibo levels, we are expecting it to be halted around $1126. If any further pullback is able to breach the mentioned high, a short entfy to sell in wave five (v) could be considered, the end of the wave depends on the bearish strength momentum. If it includes low strength, $1080 could be seen as an end for the rally. But if the price is able to break $1126 by any further pulback, the next resistance level will be $1143 for the end of wave (iv), this area afterward could be considered as an entry to go short for wave (v).
Result
.


EURAUD

The price is still going bullish. on the daily chart, according to the wave counting, it is comleteing wave 5 of larger wave 3 which the upper channel line appears to be an end for that wave. As it shows, the price is completeing wave 4 of 5 of 3, which seems to have 1.4950 area as support area potentially. Within this area, we ought to look for wave 5 of 5 of 3 to find an entry trigger.
Result
.

Sunday, August 16, 2015

NZDCHF

On the h4 chart, the price is within the reciprocal ab=cd   harmonic pattern range. We are expecting to have a surge if the demand fuels up across the market.
.

Saturday, August 15, 2015

GBPUSD

on the h4 chart, the price is swinging inside a neutral rectangle. if it breaks out of the rectangle, it is expected for the price to continue trendy. as long as the price fluctuates within the area, couple of wave running could be considered.
.

EURUSD

On the h4 chart, having the  ab=cd  harmonic pattern  formed a reversal is in sight. If the situation continues, we will have more drops coming in the market.
.

Thursday, August 13, 2015

OIL

On the daily chart of the crude oil, a non-ideal alt bat pattern is on sight it is expected to have a rebound if the price got steady around $42 a barrel.
.

GBPCHF

On our H4 chart, we see a reversal from top bullish channel by a bearish divergence formation. Currently and based on the head & shoulders pattern in MACD, we are expecting a drop if the S to R conversion area is broken down below 1.5130.
RESULT
.


Wednesday, August 12, 2015

GBPJPY

On the m30 chart, having the  ending diagonal   pattern  formed a reversal is in sight. If the situation continues, we will have more drops coming in the market.
Result
.

Tuesday, August 11, 2015

EURGBP

On the daily chart, we have a reversal happening from the ab=cd harmonic pattern area. It is expected to have a growth acrpss the market if the dearish trend line is breached and then broken around 0.7161 .
Result
.


Sunday, August 9, 2015

EURUSD

As you can see on the daily chart, the price is moving forward inside a triangle. The line is around 1.1041, so we will be hopefully tracking it to 1.1345, if there is a break through the neck line. To go short, we have to wait for clear breach through 1.0830.

Result
.

NZDUSD

As it is showing on the daily chart, the price failed to break the low at 16 july and had been supported by the bulls, so a fourth zigzag wave is expected to the up. Therefore, the long side to $0.6880 as the first position could be considered by having the price crossed $0.6666. Thereafter, a trigger to follow the fifth wave is on track.
.

Wednesday, August 5, 2015

GBPCHF

On the h4 chart, having the  ab=cd  harmonic pattern  formed a reversal is in sight. If the situation continues, we will have more drops coming in the market.
.

GBPCAD

On the daily chart, having the  crab  harmonic pattern  formed a reversal is in sight. If the situation continues, we will have more drops coming in the market.
.

Tuesday, August 4, 2015

GBPJPY

we are expecting a drop if the price flies above the resistance area then having that converted to a support on our h1 chart.
.