Tuesday, December 30, 2014

EURUSD


According to the structure on the daily chart, the price is fluctuating inside a congestion area. We are expecting to have it fueled up to 1.2400 zone by breaking 1.2230 area. The price will be entered into the bullish case if it stabilized over the upper aforementioned level.
.
.


AUDNZD

On the H1 chart, the price is fluctuating inside a wedge. According to the current  condition on the chart, we are expecting to have a growth by the pair if 1.0467 area is broken above. In case the price violates below the lower triangle, the forecast will be rescinded.
.Result
.

Sunday, December 28, 2014

GBPNZD

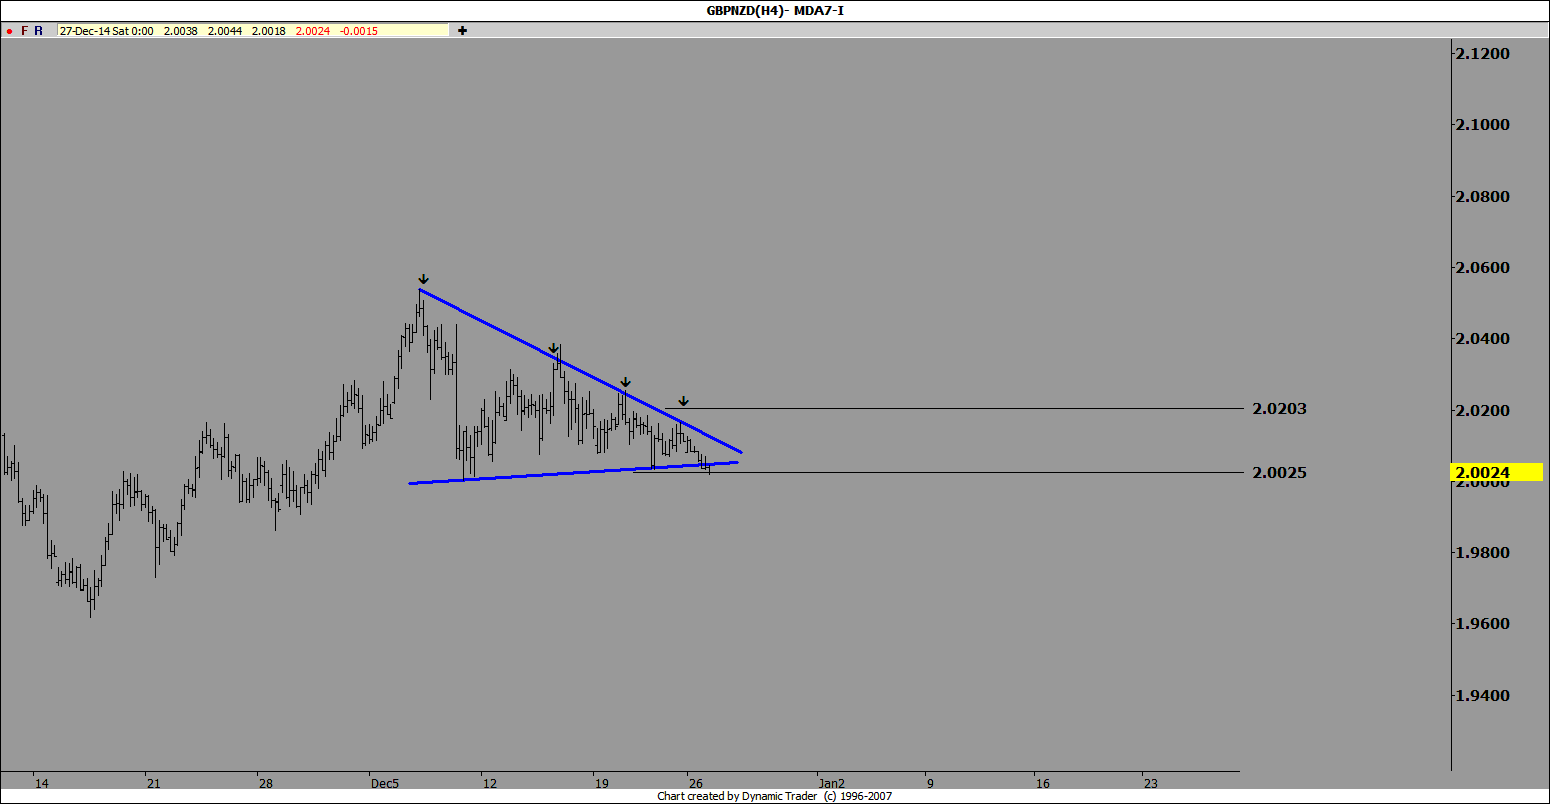
on the H4 the price is fluctuating within a congestion area. we are expecting to have a drop by the pair if 2.0000 zone is broken below
.

 .

EURUSD

on the H1 TF, a shark harmonic pattern on the pullback from the trend line is in sight. according to its time being fulfilled, we are expecting to have a willing on the buy side raised by the pair if 1.2185 area is broken above, the targeted zones would be 1,2218 and 1,2260. the stop loss for both zones is 1.2160
.

 
 .

Tuesday, December 23, 2014

GBPJPY

As shown on the chart below, a Bat pattern is in sight on the H4 TF. Based on the negative hidden divergence, we are expecting to see a drop into 185.00 and 183.40 area by having 186.30 level violated below, considering 187.90 as a S/L.
Result
.


Saturday, December 20, 2014

USD CHF


On the monthly chart, the price is going bearish and currently there are swings within the level conversion zone. We are expecting the price to go upward if the trend line is being violated and the price is stabilized above that line.

.

USD CAD


On the daily TF a harmonic pattern is in sight. We will be countering with a drop if the supply force taken over the demand force of the market.

.

NZD JPY


On the H4 chart, we can see a rebound is coming in by having a harmonic pattern and negative hidden divergence being formed. We are expecting a drop if the selling/supply pressure persisted.

.

EUR CAD


On the H4 chart, the price is going bullish. It looks the closer it gets to the trend line, the risk would be lower going long. By having the positive hidden divergence occurred, expectation would raise for higher levels.

.

AUDUSD


On the H1 chart, a harmonic pattern is in sight. According to its time being fulfilled, we are expecting a growth by the pair if it is poised for.

.