On the H4 chart, having theab=cd harmonic pattern formed a reversal is in sight. If the situation continues, we will have more drops coming in the market.
As youcan see on chart, the price has entered a correction wave after an "five-wave" impulse, which is expected to extend to Oct. 29th and 0.6640-0.6565 if the neck line is broken above and thereafter, it would again go bullish. Bearish outlook is valid as long as the price remains below 0.6900.
On the daily chart, the chart is fluctuating inside a consolidation area. We are expecting a move in line with the trend by having the price out of this box.
On the H4 chart, having the butterfly harmonic pattern formed a reversal is in sight. If the situation continues, we will have more drops coming in the market.
On our H4 chart the price is playing bearish and a positive divergence is on sight with the price rebounding up. we are expecting to see a bullish bias if the trendline is breached around 1.6890.
On the H4 chart, having the butterfly harmonic pattern formed a reversal is in sight. If the situation continues, we will have more drops coming in the market.
On the h1 chart, the chart is fluctuating inside a consolidation area. We are expecting a move in line with the trend by having the price out of this box.
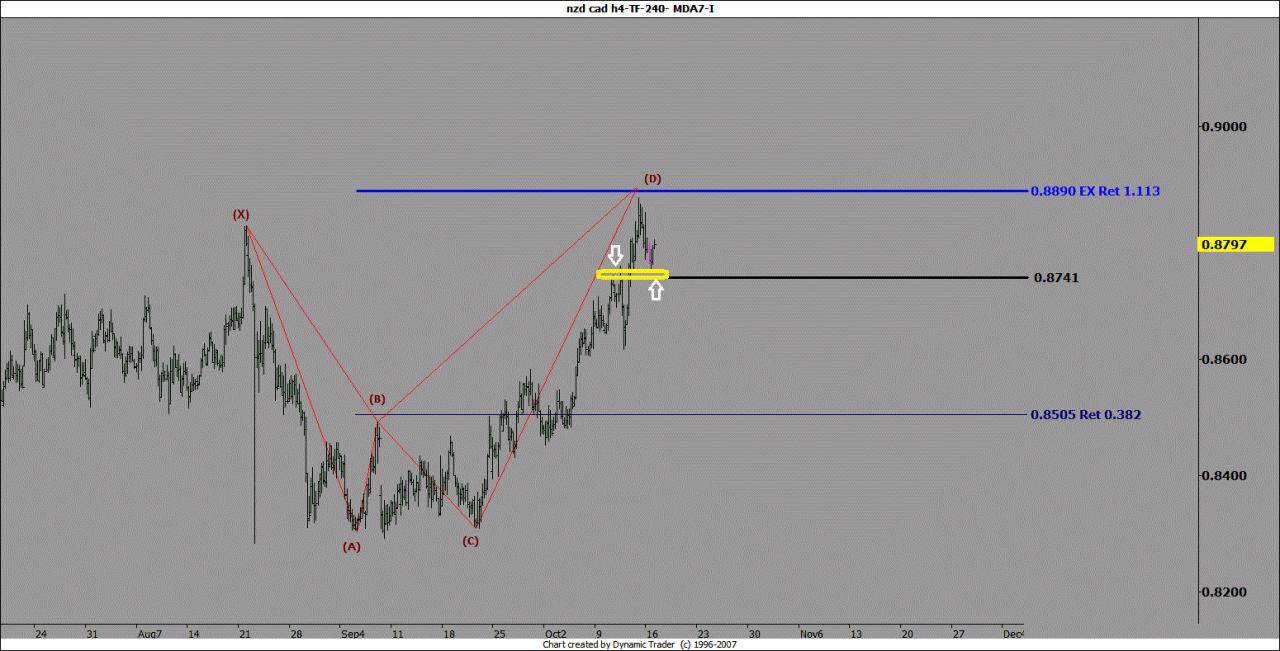
On the H4 chart, we see price reversal from around non-ideal alt bat pattern. If the conversion area around 0.8740 is broken below as it goes on, a drop is expected eventually.
On the daily chart, the price is moving up on the bullish trend line and a resistant to support conversion process is being done simultaneously. It is expected to have a rise if a positive hidden divergence is completed.
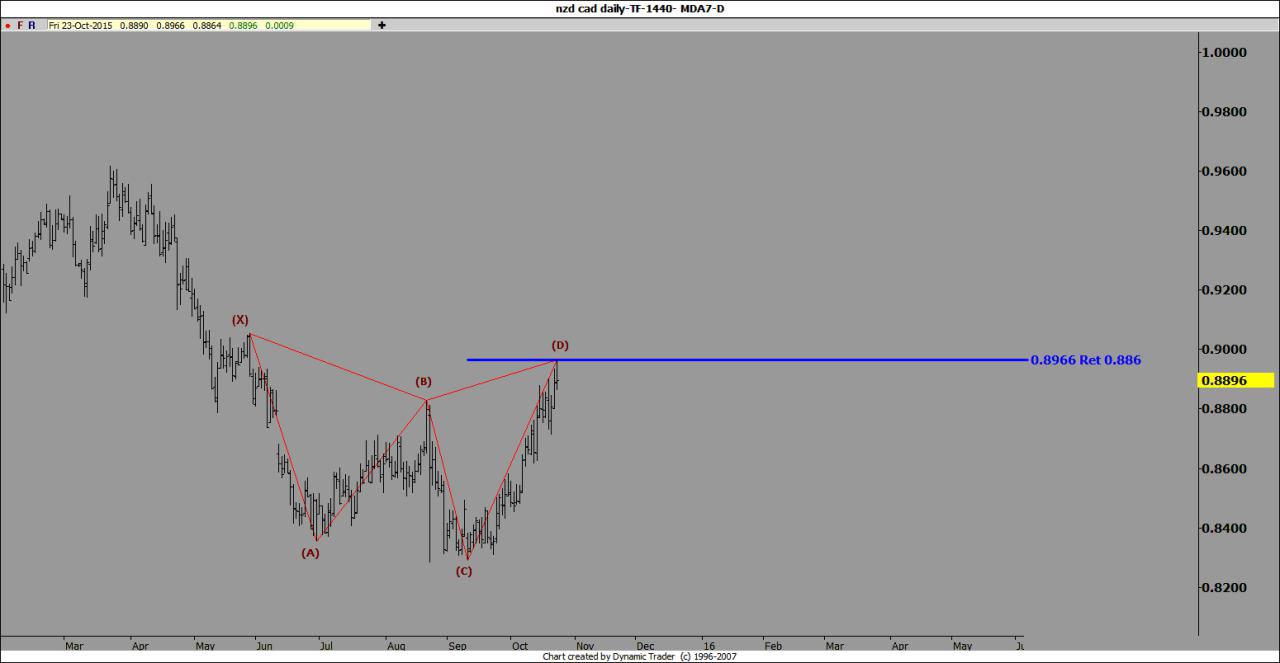
On the daily chart, having the ab=cd and butterfly harmonic pattern formed a reversal is in sight. If the situation continues, we will have more drops coming in the market.
On the daily chart, the price is within the inv ab=cd harmonic pattern range. We are expecting to have a surge if the demand fuels up across the market.
On the H4 chart, having the ab=cd harmonic pattern formed a reversal is in sight. If the situation continues, we will have more drops coming in the market.
On the H4 chart, having the ab=cd harmonic pattern formed a reversal is in sight. If the situation continues, we will have more drops coming in the market.
On our H4 chart the price is playing bearish and a positive divergence is on sight with the price rebounding up. we are expecting to see a bullish bias if the trendline is breached around 2.3030
On the daily chart, the chart is fluctuating inside a consolidation area. We are expecting a move in line with the trend by having the price out of this box.
In the h4 chart, the price is rebounding from the channel's upper line by a bearish divergence formation. It is currently broken below. It is expected to drop by the pair if it gains firm footing on the market.
On the H4 chart, having the BAT harmonic pattern formed a reversal is in sight. If the situation continues, we will have more drops coming in the market.
On the daily chart, the price is fluctuating inside a bearish channel. We are expecting a trendy move, if the price violates the top or button of the box.
On the h4 chart, the price is fluctuating inside a bearish channel. We are expecting a trendy move, if the price violates the top or button of the box.
on the h4 chart, the price is swinging inside a neutral rectangle. if it breaks out of the rectangle, it is expected for the price to continue trendy. as long as the price fluctuates within the area, couple of wave running could be considered.
In the daily chart, the price is rebounding from the channel's upper line by a bearish divergence formation. It is currently broken below. It is expected to drop by the pair if it gains firm footing on the market.
On the H4 chart, the price is within the shark except harmonic pattern range. We are expecting to have a surge if the demand fuels up across the market.
On the weekly chart, having the ab=cd harmonic pattern formed a reversal is in sight. If the situation continues, we will have more drops coming in the market.
 .
.