Friday, July 31, 2015

GOLD

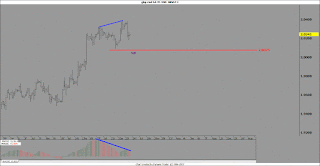
On the h1 chart, we have a reversal happening from the Bat harmonic pattern area. It is expected to have a growth acrpss the market if the dearish trend line is breached and then broken around $1104.
Result
.


GBPAUD

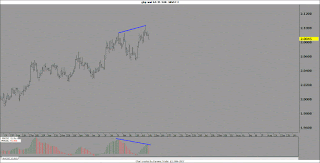
On H4 chart, we can see a rebound by having a bearish divergence formation taken into shape. it is expected to see a drop if the selling pressure exists all around the market.
.

Thursday, July 30, 2015

AUDUSD

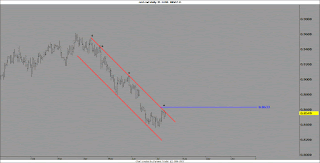
On the daily chart, the price is within the ab=cd   harmonic pattern range. We are expecting to have a surge if the demand fuels up across the market.
.

Wednesday, July 29, 2015

EURUSD

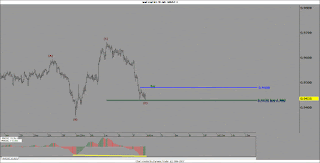
On the h4 chart, having the inv ab=cd  harmonic pattern  formed a reversal is in sight. If the situation continues, we will have more drops coming in the market.
Result
.

Tuesday, July 28, 2015

GBPNZD

On the Daily chart, a Head and Shoulders Bottom pattern is in sight in the MACD.We are expecting to see a drop by the pair if the supply fuels up across the market.
.

GOLD

Based on the structure, a Head and Shoulders Bottom is in sight on the h1 chart. We are expecting to have a upward move to around 1133 $ , if the neckline is broken around 1105 $, while having s/l at 1076$.
.

NZDUSD

On the h4 chart, the price is fluctuating inside a bearish channel. We are expecting a trendy move,  if the price violates the top or button of the box.
.

GBPAUD

On H4 chart, we can see a rebound by having a bearish divergence formation taken into shape. it is expected to see a drop if the selling pressure exists all around the market.
.

Saturday, July 25, 2015

CADCHF

On our H4 chart the price is playing bearish and a positive divergence is on sight with the price rebounding up. we are expecting to see a bullish bias if the trendline is breached around 0.7400 .
RESULT
.

Thursday, July 23, 2015

AUDJPY

On the H4 chart, the chart is fluctuating inside a consolidation area. We are expecting a move in line with the trend by having the price out of this box.

RESULT
.


GBPCHF

On H4 chart, we can see a rebound by having a bearish divergence formation taken into shape. it is expected to see a drop if the selling pressure exists all around the market.
.


GBPCAD

On H4 chart, we can see a rebound by having a bearish divergence formation taken into shape. it is expected to see a drop if the selling pressure exists all around the market.
.

Wednesday, July 22, 2015

NZDJPY

On our H4 chart the price is playing bearish and a positive divergence is on sight with the price rebounding up. we are expecting to see a bullish bias if the trendline is breached around 83.00
.

GOLD

On our H1 chart the price is playing bearish and a positive divergence is on sight with the price rebounding up. we are expecting to see a bullish bias if the trendline is breached around 1101$.
.


Monday, July 20, 2015

EURUSD

On the h4 chart, the price is within the ab=cd and butterfly  harmonic patterns range. We are expecting to have a surge if the demand fuels up across the market.
RESULT
.


Sunday, July 19, 2015

NZDUSD

On the h4 chart, the price is within the crab  harmonic pattern range. We are expecting to have a surge if the demand fuels up across the market.
Result
.


Saturday, July 18, 2015

GBPCAD

On the h1 chart, the price is playing on the upward trend line and we can see a rebound by having a bearish divergence formation taken into shape.We are expecting to see a drop by the pair if the supply fuels up across the market.
.

Thursday, July 16, 2015

GBPJPY

we are expecting a drop if the price flies above the resistance line then having that converted to a support on our h1 chart.
.

GBPAUD

On the h4 chart, having the  ab=cd  harmonic pattern  formed a reversal is in sight. If the situation continues, we will have more drops coming in the market.
.

GBPNZD

On the monthly chart, having the inv ab=cd  harmonic pattern  formed a reversal is in sight. If the situation continues, we will have more drops coming in the market.
.

Wednesday, July 15, 2015

USDCHF

on the daily chart, the price is swinging inside a neutral rectangle. if it breaks out of the rectangle, it is expected for the price to continue trendy. as long as the price fluctuates within the area, couple of wave running could be considered.
Result

EURAUD

On the daily chart, having the shark  harmonic pattern  formed a reversal is in sight. If the situation continues, we will have more drops coming in the market.
.

Monday, July 13, 2015

GBPAUD

On H4 chart, we can see a rebound by having a bearish divergence formation taken into shape. it is expected to see a drop if the selling pressure exists all around the market.
.

Sunday, July 12, 2015

NZDCAD

On the daily chart, the price is fluctuating inside a bearish channel. We are expecting a trendy move,  if the price violates the top or button of the box.
.

Saturday, July 11, 2015

GBPJPY

On the h1 chart, having the bat  harmonic pattern  formed a reversal is in sight. If the situation continues, we will have more drops coming in the market.
.


USOIL

As you can see on the chart below, the price is waving down which seems to be a zig-zag structure that is completing sub-waves of the large wave c. We are expecting wave c to be finalized aftera complex intermediate wave 4 around $48 and it will rise from the area thereafter.
.

Friday, July 10, 2015

USDCAD

On the daily chart, having the ab=cd  harmonic pattern  formed a reversal is in sight. If the situation continues, we will have more drops coming in the market.
.

EURUSD

On the h4 chart, the price is within the shark  harmonic pattern range. We are expecting to have a surge if the demand fuels up across the market.

.


Thursday, July 9, 2015

EURCHF

On H4 chart, the price is going down. a the trend line is breached to the top, it will start a bullish move.
RESULT
.


Wednesday, July 8, 2015

AUDUSD

On the monthly chart, the price is within the inv ab=cd  harmonic pattern range. We are expecting to have a surge if the demand fuels up across the market.
.

GOLD

On the daily chart, the price is within the shark  harmonic pattern range. We are expecting to have a surge if the demand fuels up across the market.
.

Tuesday, July 7, 2015

GBPNZD


On the h1 chart, having the ending diagonal  pattern  formed a reversal is in sight. If the situation continues, we will have more drops coming in the marke.
Rsult
.

NZDCHF

On the H4 chart, the chart is fluctuating inside a consolidation area. We are expecting a move in line with the trend by having the price out of this box.

.

Monday, July 6, 2015

GOLD

On the h4 chart, the price is within the shark  harmonic pattern range. We are expecting to have a surge if the demand fuels up across the market.
.
 

NZDUSD

On the h4 chart, the price is fluctuating inside a bearish channel. We are expecting a trendy move,  if the price violates the top or button of the box.
.

Friday, July 3, 2015

AUDCAD

On the h1 chart, the price is within the inv ab=cd  harmonic pattern range. We are expecting to have a surge if the demand fuels up across the market.
Result
.

GBPNZD

On the h1 chart, having the ending diagonal  pattern  formed a reversal is in sight. If the situation continues, we will have more drops coming in the marke.
.


GBPCAD

On the daily chart, having the alt bat  harmonic pattern  formed a reversal is in sight. If the situation continues, we will have more drops coming in the market.
.


GBPAUD

On the daily chart, having the crab  harmonic pattern  formed a reversal is in sight. If the situation continues, we will have more drops coming in the market.
.

Thursday, July 2, 2015

AUDNZD

On H4 chart, we can see a rebound by having a bearish divergence formation taken into shape. it is expected to see a drop if the selling pressure exists all around the market.
Rsult