Saturday, February 28, 2015

GBPUSD

On the h4 chart, by having the  shark and bat harmonic patterns  formed a reversal is in sight. If the situation continues, we will have more drops coming in the market
Result
.


USDCAD

On the h4 chart, the chart is fluctuating inside a consolidation area. We are expecting a move in line with the trend by having the price out of this box.

.

GBPCAD

On the H4 chart, we saw a down reversal after having a harmonic pattern from the ceiling of the uptrend channel formed. As the chart goes on, the price will enter into the bearish phase if the bottom of the channel around 1.9150 is broken below.

Result
.

NZDCAD

On the h1 chart, the price is within the Bat  harmonic pattern range and currently a negative  divergence is in sight. We are expecting a drop by the pair if the supply/sell pressure existed across the market.
 
.

AUDNZD

On the h1 chart, the price is within the shark  harmonic pattern range. We are expecting to have a surge if the demand fuels up across the market.

.

Thursday, February 26, 2015

GOLD

On the daily TF, the price is within the reciprocal ab=cd  harmonic pattern range.Its time will be fulfilled till th mar. 2th.Based on the negative hidden divergence,We are expecting to have a surge if the demand fuels up across the market.
.

NZDCHF

On the h4 chart, the price is placed inside a bullish channel. As long as it fluctuates within the channel, the best to do is bargain hunting on the low and or letting the bird to go on sky’s top. We are expecting to have a trendy move by having the price off the box.
.

Wednesday, February 25, 2015

AUDJPY

On the daily chart, the price is fluctuating inside a bearish channel. We are expecting a trendy move,  if the price violates the top or button of the box.
.

Monday, February 23, 2015

GBPJPY

On the h4 the price consolidated inside a box. We are expecting a trendy move by getting it above and out of the box.
.

EURCHF

On the h1 chart, we have an shark  harmonic pattern. We are expecting a drop by the pair if the supply/sell pressure existed across the market.
Result
.


Saturday, February 21, 2015

GBPCHF

on the daily chart,the price is in. its correction phase. we are expecting a drop  if a negative hidden divergence happened .
.

Friday, February 20, 2015

GBPCAD

On the H4 chart, the price is getting out of the box. We are expecting to see a drop if 1.8980 level is broken below.
.

Wednesday, February 18, 2015

EURNZD

On the h4 chart, the price is close to two harmonic patterns shark and butterfly. If the condition is good enough and having the demand overcome to the supply, we are expecting a reversal.

.


Sunday, February 15, 2015

USOIL

the scene of the chart shows a five -wave triangle which could appear as a w pattern and then the x leg and the final target zone is forecasted on $58 - $63 .
Result
.


Saturday, February 14, 2015

GBPJPY


On the daily chart, the price is going downward and currently a negative hidden divergence is in sight. As long as the trend line is not broken above, we will see a drop in the pair if the supply pressure fuelled up.

.

GBPCHF


On the H1 chart, we are facing with a negative divergence. We are expecting to have the market ready for a drop if the 1.4250 support level is crashed below.

.

GBPCAD


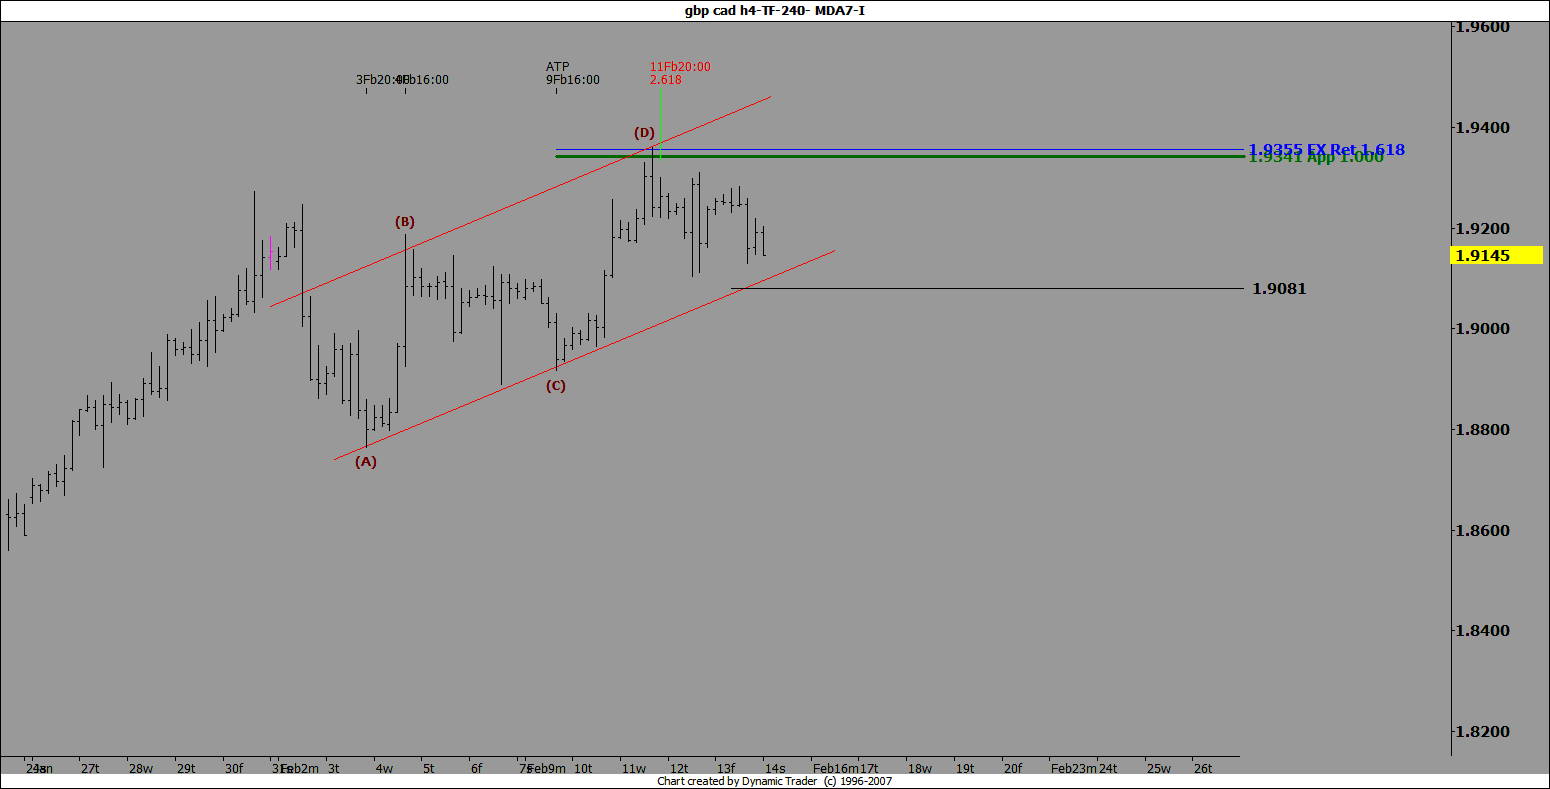
On the H4 chart, we saw a down reversal after having a harmonic pattern from the ceiling of the uptrend channel formed. As the chart goes on, the price will enter into the bearish phase if the bottom of the channel around 1.9080 is broken below.

.

GBPAUD


On the daily chart, we have an ab=cd harmonic pattern. We are expecting a drop by the pair if the supply/sell pressure existed across the market.

Result
.


Thursday, February 12, 2015

AUDNZD

On the h4 chart, the price is within the harmonic pattern range. We are expecting to have a surge if the demand fuels up across the market.
.

AUDUSD

On the h4 TF, the price is within the Bat  harmonic pattern range. We are expecting to have a surge if the demand fuels up across the market.
Result
.


Wednesday, February 11, 2015

GOLD

On the h4 TF, the price is within the butterfly  harmonic pattern range.we are expecting to have a fuel up by the pair if the RD+ cinfirmes that.
.


Sunday, February 8, 2015

USDCHF


On the H1 chart, the price is fluctuating inside a bearish channel. We are expecting a trendy move,  if the price violates the top or button of the box.

Result
.